

At pi Ventures, we invest in companies addressing global problems through 10x disruptive technology innovation. The central challenge: identifying them early enough to matter, but not so early that neither technology nor market is ready.
This document consolidates 2 interconnected frameworks for thesis building, deal evaluation, and portfolio tracking: the Demand & Supply Resonance Map, the Market Centricity Framework, and their longitudinal application to a portfolio company trajectory.
This is Part 3 of a 3-part series. Kalai helped us develop & structure this into a comprehensive deeptech investment framework series.
PART 3: PORTFOLIO APPLICATION
Agnikul Cosmos: Pre-Series A to Commercial Platform (2020-2026)
The frameworks applied longitudinally show not just where a startup is, but how it got there and where structural conditions favour the next phase.
Timeline: March 2020 (pre-Series A) to February 2026. Five years. World's first 3D-printed rocket engine in flight. India's first private launchpad. Orbital data centre platform partnership announced.
Demand & Supply Map Analysis
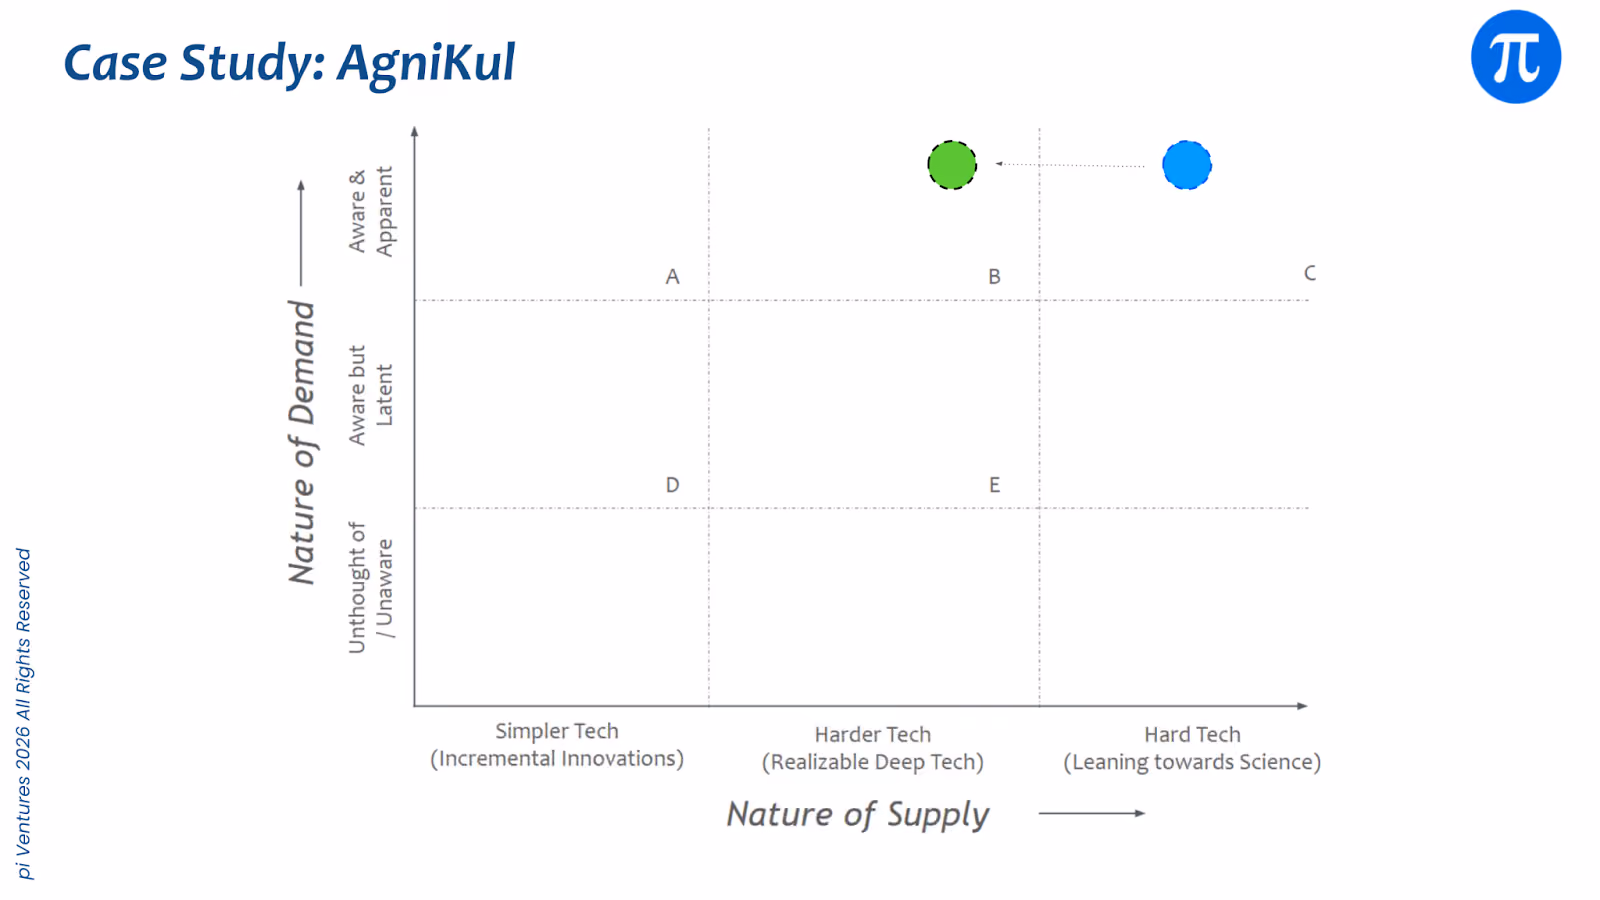
Small satellite launch market. Y-axis: demand intensity. X-axis: supply adequacy. Upper-right quadrant (high demand, constrained supply) carries structural tailwinds.
2020: LEO constellation buildout starving for launch capacity. SpaceX rideshare only option. 18-24 month backlogs. Upper-right position: pure tailwind.
2025: SOrTeD flight completed (May 2024). Technical risk reduced. Supply gap narrowing but not closed. Backlog of 12+ operators. Still favourable, moving leftward.
2030: Supply competition rises. Demand remains strong. Upper-left position: execution game. Platform differentiation (reusable, cadence, orbital infrastructure) becomes moat.
Summary:
Status: Demand becomes apparent from being latent Technology simplifies while still being relatively hard
Inference(s): Demand is structurally there, value creation is turning hard tech into repeatable operations (cadence, reliability, flexibility)
Market Centricity Evolution
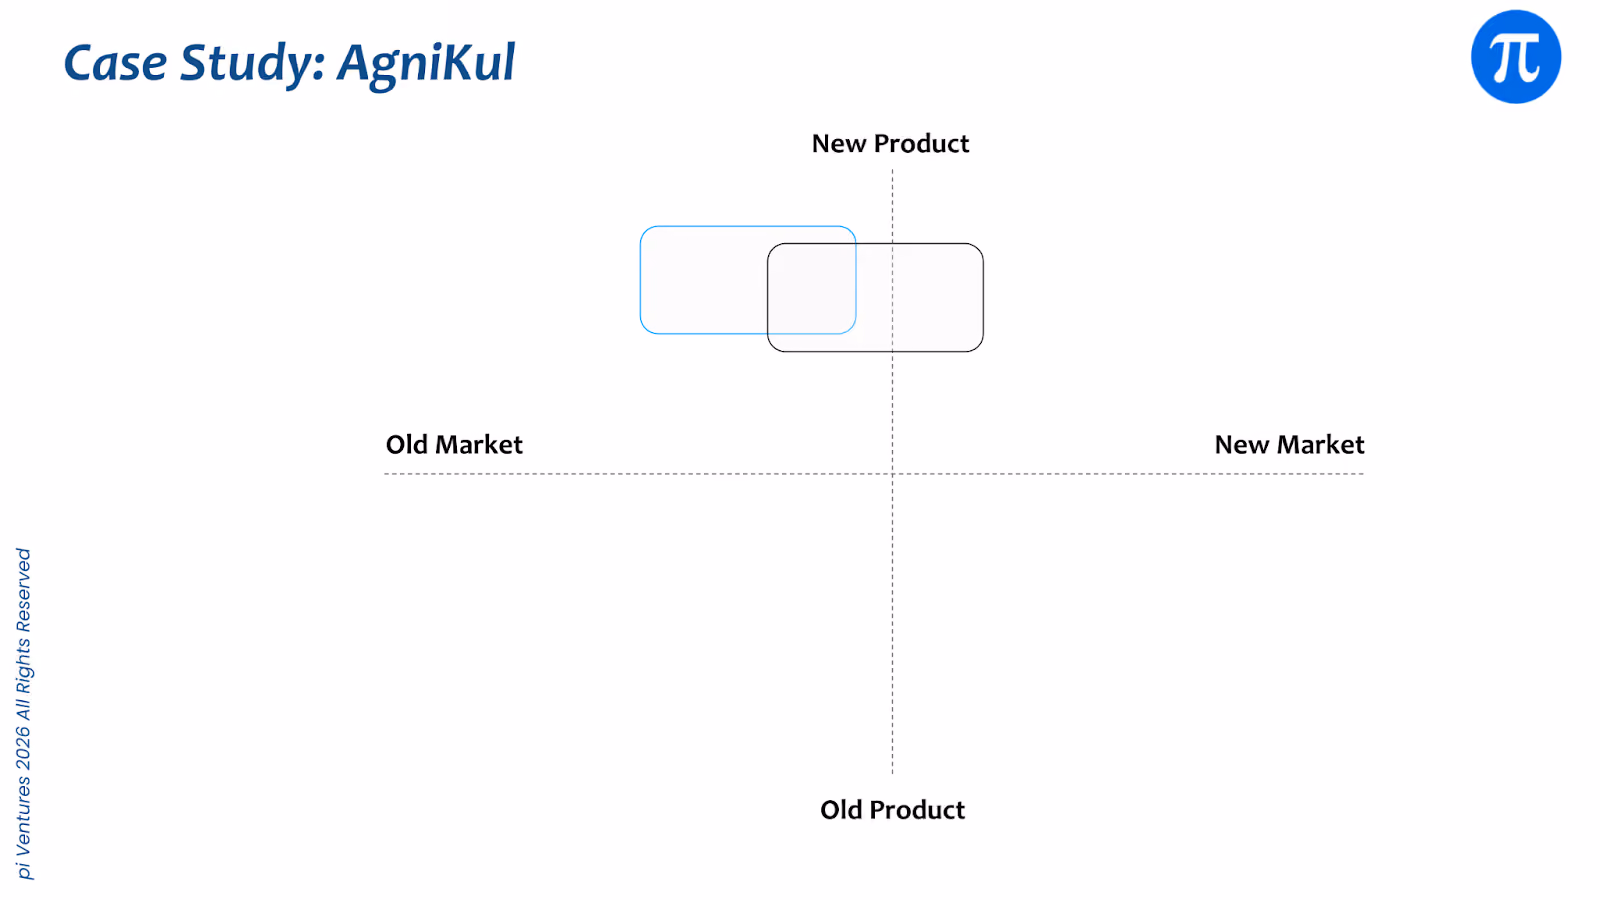
X-axis: Market maturity. Y-axis: Product maturity.
2020: Re-segmented entry.
New product (3D-printed engines) introduced into an established launch market.
- Buyer need is very acute: smallsat launch demand already visible.
- Customer personas are known and identifiable: smallsat operators, constellation builders.
- Procurement model clear: launch service contracts.
- Market structure established: multiple launch providers competing on price and cadence.
In short, Commercial risk was lower than technical risk, since the demand side was already validated.
2025+: New market creation alongside the existing launch market.
- Agnikul is exploring a new product category (orbital data centre platform) while continuing to serve the existing launch market.
- Buyer needs are beginning to crystallize around orbital AI inference, edge computing, and in-orbit data processing closer to sensors.
- Customer personas expanding beyond traditional launch buyers into earth observation firms, climate analytics companies, sovereign compute initiatives, and large enterprises exploring space-based infrastructure.
- Procurement models likely to evolve across hosted compute payloads, infrastructure leasing, platform access, and mission-specific compute contracts.
- Market structure in early formation, creating an opportunity for early players to help define the category, ecosystem and business model.
In short, this represents a brand new market layer being created on top of the launch market, where the opportunity lies in shaping the new category while building on Agnikul’s existing space infrastructure capabilities.
The Pattern
Resonance Map explains why pre-flight was fundable: supply gap + proven demand + structural tailwind.
Market Centricity explains what is being built: Re-segmented position maturing into platform with Invented Market layer.
Durable deeptech companies emerge through this arc: new products in existing markets, followed by discovery of genuinely new markets the old technology could not serve.
Using These Frameworks
These frameworks are practical thinking tools for thesis building, deal evaluation, and portfolio tracking in deeptech investing.
A simple way to apply them is outlined below.
1. Map the Technology-Market position:
- Use the Demand-Supply Resonance Map to identify where the technology sits relative to market readiness.
- Evaluate the maturity of supporting infrastructure, regulation, and ecosystem dependencies.
- Understand whether the technology is entering a market that is already prepared or one that still needs enabling layers.
- Understand estimated velocity and path (which is maturing faster - tech / demand) for the startup/thesis.
2. Assess Market Centricity:
- Determine whether the startup is responding to existing demand pull or pushing a technology ahead of the market.
- Evaluate whether customers are already allocating budgets for this category.
- Identify if adoption requires behavioral change, ecosystem buildout, or regulatory shifts.
3. Trace the Expected Evolution Path
- Map how the startup could move across stages over the next 3 to 7 years.
- Consider triggers that may accelerate or delay adoption such as infrastructure readiness, cost curves, regulation, or adjacent technology breakthroughs.
- Evaluate whether the startup’s roadmap aligns with these shifts.
4. Guide Investment Timing and Conviction
- Use the position on the map to inform entry timing and risk tolerance.
- Early-stage technologies may offer asymmetric upside but require longer holding periods.
- More mature segments may provide faster adoption but lower alpha to investors.
5. Apply the Framework at the Portfolio Level
- Use these frameworks to maintain balanced exposure across the portfolio, based on investor/firm’s risk preference.
- Track investments across different maturity zones such as infrastructure-building, emerging demand, and scaled adoption.
- This helps with taking a calculated portfolio level position in technologies that depend on the same external milestones.
6. Identify Mispriced Opportunities:
- Look for situations where technology readiness and market perception are temporarily out of sync.
- Some technologies may appear early but are supported by rapidly improving infrastructure or cost curves.
- Others may appear mature but still face hidden adoption barriers.
7. Revisit the Map Over Time:
- Re-evaluating the frameworks periodically helps track how startups move across stages.
- Changes in regulation, infrastructure, cost curves, or customer behavior can shift the position of an entire category.
- This allows investors to refine conviction and adjust portfolio exposure.
These frameworks are not prediction tools. They are thinking tools that make deeptech investment reasoning explicit, structured, and comparable across opportunities.